Traderfx
- Support and resistance are price zones where orders cluster — not exact lines.
- The strongest levels come from higher timeframes, clear reactions and old highs or lows that everyone can see.
- Trade them in two ways: the bounce (rejection) or the break-and-retest — never in the middle of nowhere.
Support and resistance are the foundation of almost every trading strategy. Whether you trade price action, smart-money concepts, indicators or news, you will eventually ask the same question: where is price likely to react? Support and resistance answer that question. They show you where buyers and sellers have stepped in before, where stops are likely to be sitting, and where your own trades should begin and end.
Yet many traders draw dozens of lines, clutter their charts and still get caught on the wrong side of the move. This guide shows you a clean, repeatable way to find the levels that matter, how to trade them, and how to avoid the classic traps.
What support and resistance really are
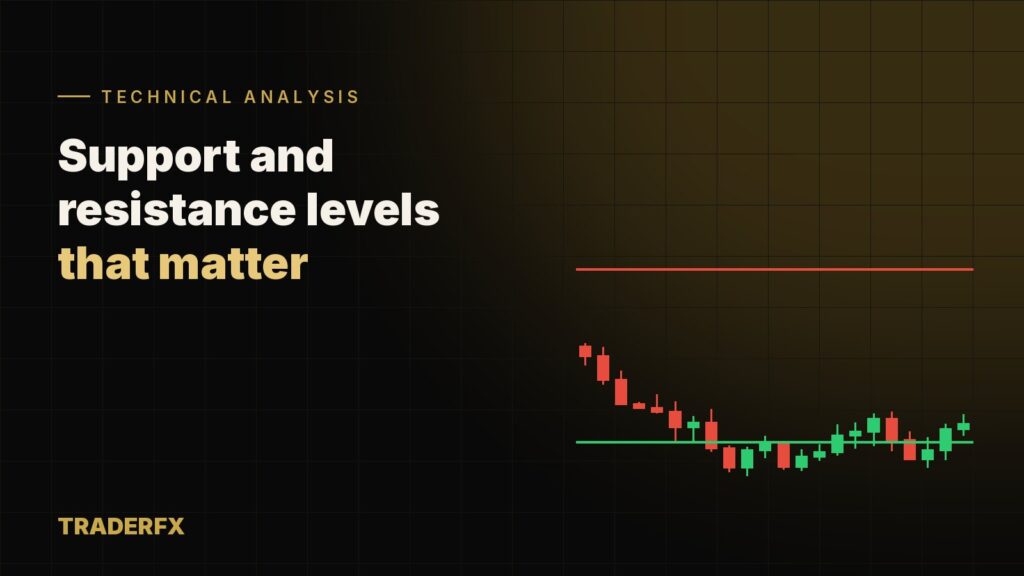
Support is a price area where falling prices have stopped and turned higher, because demand was strong enough to absorb selling. Resistance is an area where rising prices have stalled and reversed, because supply overwhelmed buying.
Why do these areas work? Because markets have memory. Traders who bought at a level and saw price rise want to buy there again. Traders who missed the move place orders at the same price. Traders who sold too early put their stop losses just above it. All of these orders cluster in the same area — and when price returns, they create a reaction.
How to find strong support and resistance levels
1. Start with higher timeframes
Open the weekly and daily charts first. Levels found there are watched by more participants, including banks and funds, and they produce bigger reactions. Mark only the most obvious swing highs and lows — the turning points you would notice even if you squinted at the chart.
2. Look for multiple clean reactions
A level gains credibility each time price reacts to it clearly. Two strong reactions are usually enough to make a level valid. Pay attention to how price left the level: a fast, impulsive move away shows real orders were sitting there.
3. Use previous highs and lows
The previous day’s high and low, the previous week’s high and low, and the most recent major swing points are some of the most reliable levels in any market. Many algorithms and institutional traders reference them directly.
4. Watch round numbers
Psychological levels such as 1.1000 on EUR/USD, 150.00 on USD/JPY, 2,400 on gold or 100,000 on Bitcoin attract orders simply because humans like round numbers. They are often strongest when they line up with a technical level.
5. Mark role reversals
When resistance breaks, it often becomes support on the retest — and vice versa. This “polarity flip” is one of the most dependable patterns in technical analysis because traders who missed the breakout use the retest as their entry.
Lines vs. zones: why zones win
Price almost never turns at the exact same tick twice. If you draw a single thin line, price will poke through it, you will think the level has failed, and then it will reverse without you. Instead, draw a zone that covers the cluster of candle bodies and wicks at the reaction point.
| Single line | Zone | |
|---|---|---|
| Precision | Looks exact, but price rarely respects it exactly | Matches how real orders cluster |
| False breaks | Frequent — wicks pierce the line | Reduced — wicks stay inside the zone |
| Stop placement | Stops often too tight | Stops go beyond the full zone |
A practical rule: on the daily chart, draw the zone from the extreme wick to the area where most bodies closed. On lower timeframes the zone will naturally be thinner.
Two ways to trade support and resistance
Strategy 1: The bounce (rejection)
You wait for price to reach a strong zone and show signs of rejection before entering in the opposite direction.
- Price reaches a higher-timeframe zone in the direction of the main trend (for example, a pullback to support in an uptrend).
- A rejection candle forms: a pin bar, a bullish engulfing candle or a morning star. See how to read candlestick charts for the details.
- Enter after the candle closes. Place the stop loss beyond the far side of the zone.
- Target the next opposing level, aiming for at least twice the risk.
Strategy 2: The break and retest
Here you trade with momentum when a level gives way.
- Price closes decisively beyond a key level — ideally with a strong, full-bodied candle.
- Do not chase the breakout candle. Wait for price to come back and retest the broken level from the other side.
- Look for a rejection on the retest, then enter with the stop on the other side of the zone.
- Target the next major level in the breakout direction.
How to tell a real breakout from a fake one
False breakouts, sometimes called stop hunts or liquidity sweeps, are one of the biggest frustrations for traders. Price pushes just beyond an obvious level, triggers stop losses and breakout orders, then snaps back. A few filters help:
- Wait for a candle close. A wick beyond the level is not a breakout; a close beyond it is.
- Check the body size. Real breakouts often come with larger-than-average candles.
- Look at the timing. Breakouts during thin liquidity — the Asian session for EUR/USD, or right before major news — fail more often. Our guide to the best time to trade forex explains the sessions.
- Watch the retest. If price slices straight back through the level, the breakout has probably failed.
Common support and resistance mistakes
- Drawing too many levels. If every price is a level, no price is. Keep three to five key zones per chart.
- Using only low timeframes. A 5-minute level means little if price is about to hit a weekly resistance.
- Placing stops exactly at the level. That is where everyone else’s stops are. Put yours beyond the full zone and size the position accordingly.
- Ignoring the trend. Buying every support in a strong downtrend is how accounts bleed slowly.
- Forgetting that levels weaken. Each test removes some of the orders waiting there. A fourth or fifth test is often the one that breaks.
Combining support and resistance with risk management
Support and resistance make risk management easier because they give you logical places for stops and targets. Before you enter, calculate the distance from entry to stop, decide how much of your account you will risk, and calculate the position size. If the next opposing level is too close to offer at least a 1:2 reward-to-risk ratio, skip the trade. The full method is in the 1% rule and position sizing.
Final thoughts
Support and resistance are simple in theory and powerful in practice — as long as you keep them clean. Start on the higher timeframes, draw zones instead of lines, wait for price to come to you, and trade either the rejection or the break-and-retest. Combine that with strict position sizing and you have a solid core for any trading plan, in forex, gold or crypto.
Trading carries a high level of risk. This content is educational and is not investment advice.